

(Beginner → Strong Foundation)
You do not need to be an Excel expert.
You only need to know the right things used in real estate modelling.
Why Excel is Used for Real Estate Modelling
Excel is used because it:
- Handles numbers easily
- Allows future projections
- Shows clear cash flow
- Helps compare scenarios
- Is accepted by banks, investors, and companies
👉 Almost every real estate model in the world is built in Excel.
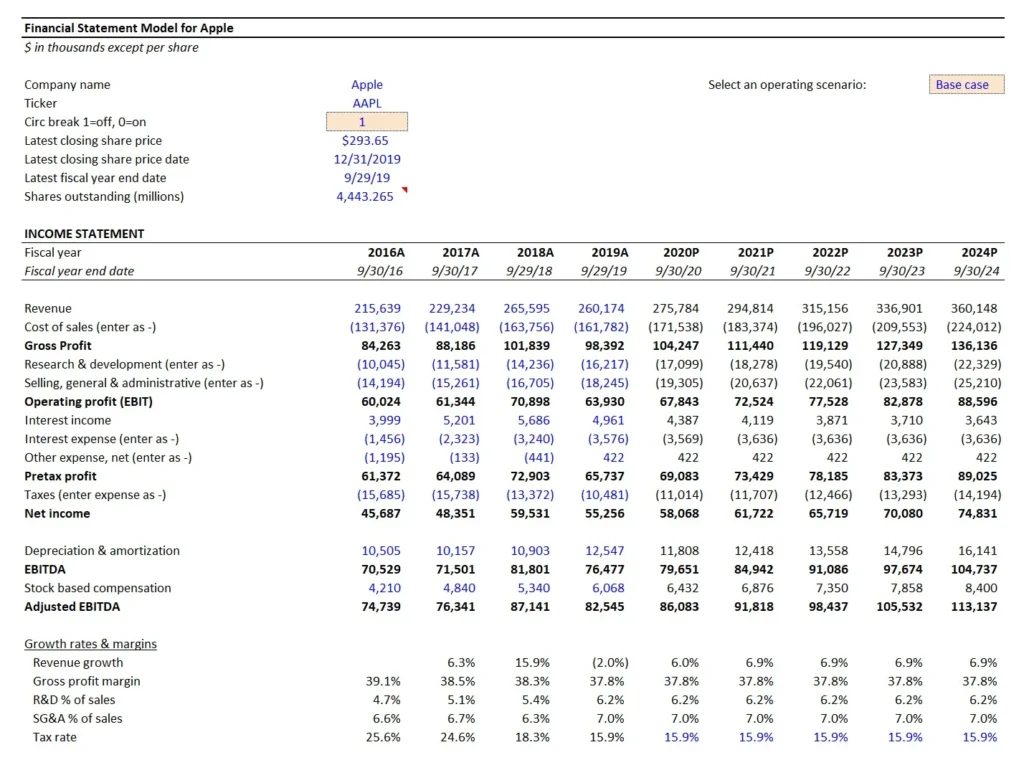
How a Real Estate Excel Model Looks
A real estate model is not random numbers.
It follows a clean structure.
Standard Sections:
- Assumptions / Inputs
- Rental Income
- Expenses
- NOI Calculation
- Loan & EMI
- Cash Flow
- Valuation
- Returns (IRR, NPV)
We will build all of this step by step.
Excel Sheet Layout – Professional Style
Before formulas, understand layout discipline.
Best Practices:
- Inputs at the top
- Calculations in the middle
- Outputs at the bottom
- One concept per row
- Years in columns (left → right)
💡 Good layout = easy understanding + fewer mistakes
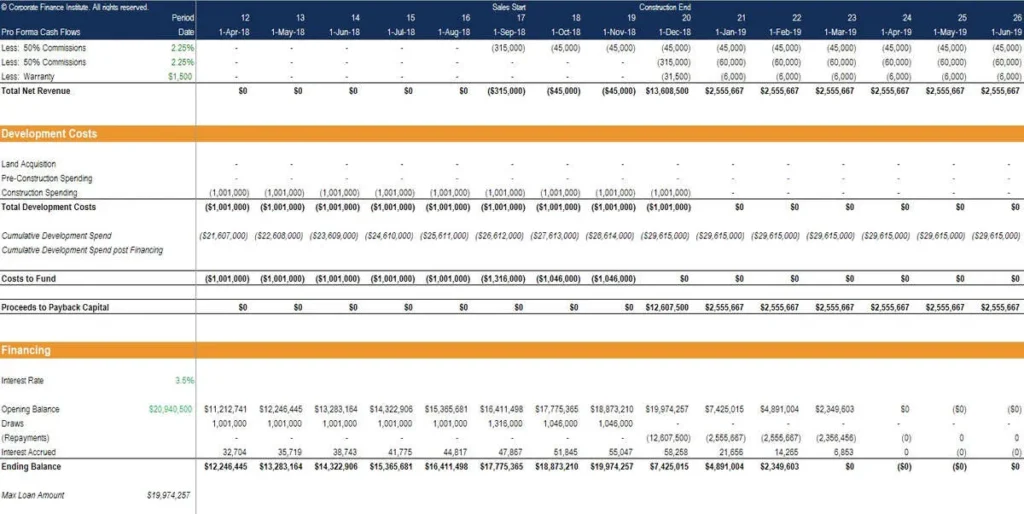
Timeline Creation (MOST IMPORTANT STEP)
Every real estate model works on a time period.
Typical Timeline:
- Year 0 → Purchase year
- Year 1 → First operating year
- Year 2 → Second year
- …
- Exit Year → Sale year
| A | B | C | D | E | |
|---|---|---|---|---|---|
| 1 | Year | 0 | 1 | 2 | 3 |
| 2 | Purchase |
👉 All cash flows move horizontally.
Timeline Visual Explanation
Cell Referencing (VERY IMPORTANT)
Excel formulas depend on cell references.
1️⃣ Relative Reference (A1)
- Changes when copied
- Used for year-wise calculations
Example:
=B5*C5
2️⃣ Absolute Reference ($A$1)
- Does NOT change
- Used for assumptions
Example:
=B5*$B$2
💡 Rent growth %, vacancy %, cap rate should be absolute.
3️⃣ Mixed Reference ($A1 or A$1)
- Used rarely
- Helpful in advanced models
Color Coding – Professional Rule
This is industry standard.
Common Color Rules:
- Blue → Inputs (you can change)
- Black → Calculations
- Green → Outputs / Results
💡 Never hardcode numbers inside formulas.
Example:
❌ =500000*5%
✅ =B5*B6
Basic Excel Functions You MUST Know
You don’t need 100 functions.
These are enough for real estate modelling.
1️⃣ SUM()
Adds numbers.
=SUM(B5:B10)
Used for:
- Total rent
- Total expenses
2️⃣ IF()
Used for conditions.
=IF(B5>0,”Profit”,”Loss”)
Used for:
- Positive / negative cash flow
- Scenario logic
3️⃣ NPV()
Calculates present value of cash flows.
=NPV(rate, cashflows)
Used in:
- Valuation
- DCF models
4️⃣ IRR()
Calculates investment return.
=IRR(cashflows)
Used to:
Judge investment attractiveness
5️⃣ PMT()
Used to calculate EMI.
=PMT(rate, periods, loan amount)
Used for:
Loan modelling
Simple Practice: First Mini Model
Let’s build your first tiny model.
Inputs:
- Monthly rent = ₹20,000
- Vacancy = 5%
- Annual expenses = ₹50,000
Excel Logic:
- Annual rent = 20,000 × 12
- Vacancy loss = Annual rent × 5%
- Effective income = Rent – Vacancy
- NOI = Effective income – Expenses
💡 You just created a real estate income model.
Common Beginner Excel Mistakes
❌ Hardcoding numbers inside formulas
❌ No timeline
❌ No separation of inputs & calculations
❌ Mixing monthly & yearly numbers
❌ No clear labels
Mini Case Study: Bad vs Good Excel Model
Bad Model:
- Random numbers
- No assumptions
- No structure
Good Model:
- Clear inputs
- Timeline-based
- Logical flow
- Easy to audit
👉 Professionals trust only good models.
Chapter 4 Summary
- Excel is the backbone of real estate modelling
- Timeline is mandatory
- Inputs must be separated
- Absolute references are critical
- Only a few Excel functions are enough
- Clean structure = professional model
What Comes Next – Chapter 5 Preview
Next chapter, we will:
- Design a full real estate model structure
- Create input sheets
- Understand professional modelling flow
- Prepare foundation for valuation & DCF
Pingback: Is Gaudium IVF the Hottest IPO of 2026? Dates, GMP, Price Band - The EquityVerse